The Statistics and Machine Learning Toolbox provides a wide range of functions and apps for analyzing and modeling data. It enables exploratory analysis using descriptive statistics, visual tools, and clustering techniques. You can fit probability distributions, carry out Monte Carlo simulations, and conduct hypothesis testing. The toolbox offers regression and classification methods that can be accessed through the Classification and Regression Learner apps or programmatically with AutoML.
For high-dimensional datasets, it includes PCA, regularization, dimensionality reduction, and feature selection approaches to highlight the most informative features. It supports supervised, semi-supervised, and unsupervised learning with algorithms such as support vector machines, boosted decision trees, shallow neural networks, and clustering techniques. To improve interpretability, it provides tools like partial dependence plots, Shapley values, and LIME. The toolbox also allows automatic generation of C/C++ code for embedded deployment and connects with Simulink for model-based workflows. In addition, it can handle large-scale datasets that exceed memory limits.
Explore data with interactive statistical plots and visual graphics, using descriptive statistics to quickly understand large datasets. Analyze measures of central tendency, dispersion, shape, correlation, and covariance to summarize data.
Cluster Analysis
Identify patterns and features by applying clustering methods like k-means, hierarchical, and DBSCAN, grouping data into clusters. Determine the optimal number of clusters using various evaluation criteria and detect anomalies to identify outliers and novelties.
ANOVA
Assign sample variance to different sources and determine whether the variation arises within or among different population groups. Use one-way, two-way, multiway, multivariate, and nonparametric ANOVA, as well as analysis of covariance (ANOCOVA) and repeated measures analysis of variance (RANOVA).
Regression
Use the Regression Learner app or code to train and evaluate models like linear regression, Gaussian processes, support vector machines, neural networks, and ensembles.
Classification
Use the Classification Learner app or code to train and validate models like logistic regression, support vector machines, boosted trees, and shallow neural networks.
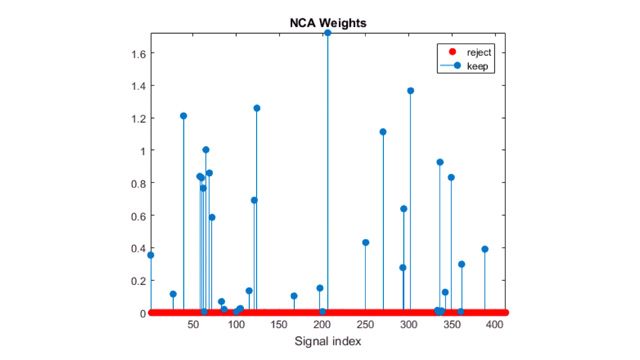
Dimensionality Reduction and Feature Extraction
Extract features from images, signals, text, and numeric data. Iteratively create and explore new features, selecting those that optimize performance. Reduce dimensionality by transforming features into new predictors and dropping less descriptive ones, or apply automated feature selection.
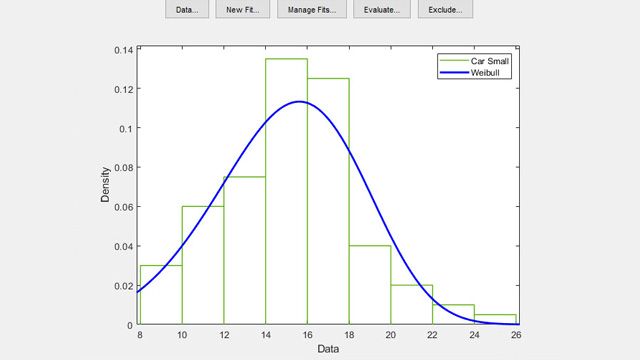
Probability Distributions
Fit continuous and discrete distributions, evaluate goodness-of-fit using statistical plots, and compute probability density and cumulative distribution functions for over 40 different distributions.
Hypothesis Tests
Draw inferences about a population from sample data by performing t-tests, distribution tests, and nonparametric tests for one, paired, or independent samples. Test for autocorrelation, randomness, and compare distributions.
Industrial Statistics
Statistically analyze data trends and effects, design experiments to manipulate inputs and study their impact on outputs. Visualize and assess time-to-failure data, both with and without censoring, and monitor the quality of industrial processes.
Analysis of Big Data with Tall Arrays
Use tall arrays and tables with classification, regression, and clustering algorithms to train models on large datasets that don’t fit in memory, without modifying your code.
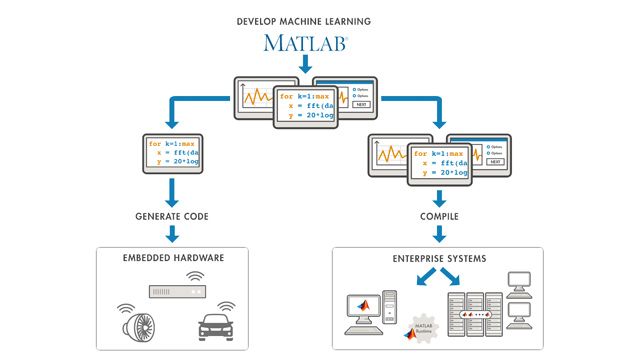
Code Generation
Generate portable and readable C/C++ code for classification and regression model inference, descriptive statistics, and probability distributions. You can create C/C++ prediction code with reduced precision and update model parameters in deployed systems without regenerating the prediction code.