A video demo of Mapping Toolbox. Available here
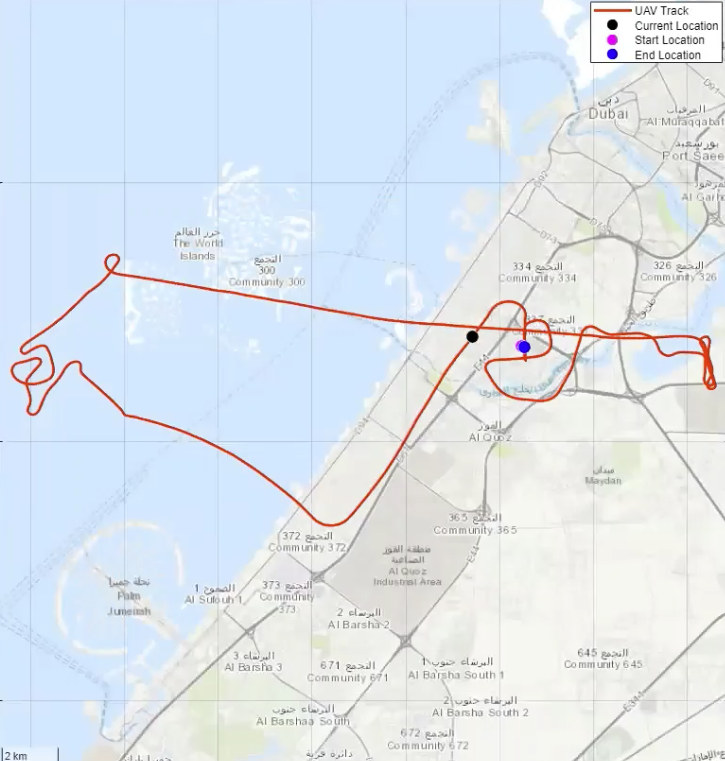
In this video, watch a small demo using the mapping solution of MATLAB. In the below video, we will explore some validations in MATLAB and Mapping Toolbox. Using the coordinates of the tallest building in the world: the Burj Khalifa in Dubai, we will display 2D and 3D geographic maps. We will include track data for an unmanned aerial vehicle (UAV) flight and simulate how it could fly over Dubai. We will synchronise the camera view using a navigation function. Finally, we will open the track in Google Earth using KML files.
Mapping Toolbox provides algorithms and functions to deal with geographic data. It allows you to create maps and visualisations.
This is a Live Script Mapping Solutions, running on MATLAB 2021a.
Overview of Mapping Toolbox
Mapping Toolbox™ provides algorithms and functions for transforming geographic data and creating map displays. You can visualize your data in a geographic context, build map displays from more than 60 map projections, and transform data from a variety of sources into a consistent geographic coordinate system.
Mapping Toolbox supports a complete workflow for managing geographic data. You can import vector and raster data from a wide range of file formats and web map servers. The toolbox lets you process and customize data using trimming, interpolation, resampling, coordinate transformations, and other techniques. Data can be combined with base map layers from multiple sources in a single map display. You can export data in file formats such as shapefile, GeoTIFF, and KML.