Polyspace Access enables software development teams to assess code quality throughout the entire development lifecycle. It includes Polyspace as You Code, an IDE plugin that helps developers identify code compliance issues, software defects, and security vulnerabilities before submitting code for integration. Polyspace Access also provides a web-based interface for reviewing static code analysis results generated by Polyspace Bug Finder Server, Polyspace Code Prover Server, and Polyspace Test.
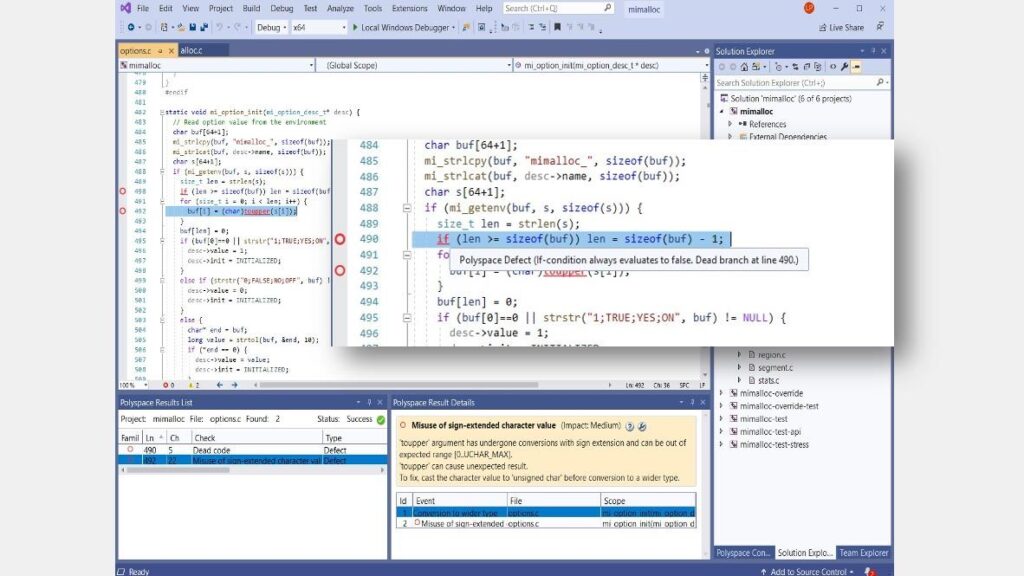
Polyspace as You Code detects critical defects and security vulnerabilities, while checking compliance with coding standards such as MISRA C®, MISRA C++, AUTOSAR C++14, CERT® C, CERT C++, and custom naming conventions. Integrated as a plugin within IDEs like Visual Studio®, Visual Studio Code, and Eclipse™, it displays results directly in the source code view. When connected to the Polyspace Access central repository, it can highlight only the new issues introduced by a developer relative to the project’s baseline.
The web interface enables developers and quality engineers to collaborate across projects on static code analysis findings. From the project dashboard to individual issue details, team members can track quality trends and review, analyze, and assign software vulnerabilities, code metrics, critical run-time errors, and coding standard compliance. Integration with project management tools such as JIRA supports team-based collaboration on code quality. Polyspace Access also includes a central repository—deployable on-premises or in the cloud—that integrates with authentication systems like LDAP to manage access to project data.
Find bugs as soon as code is written or modified by using the Polyspace as You Code plug-in within an IDE such as Visual Studio®, Visual Studio Code, or Eclipse. Use APIs to integrate into other IDEs and editors.
Comply with Coding Standards and Security Rules
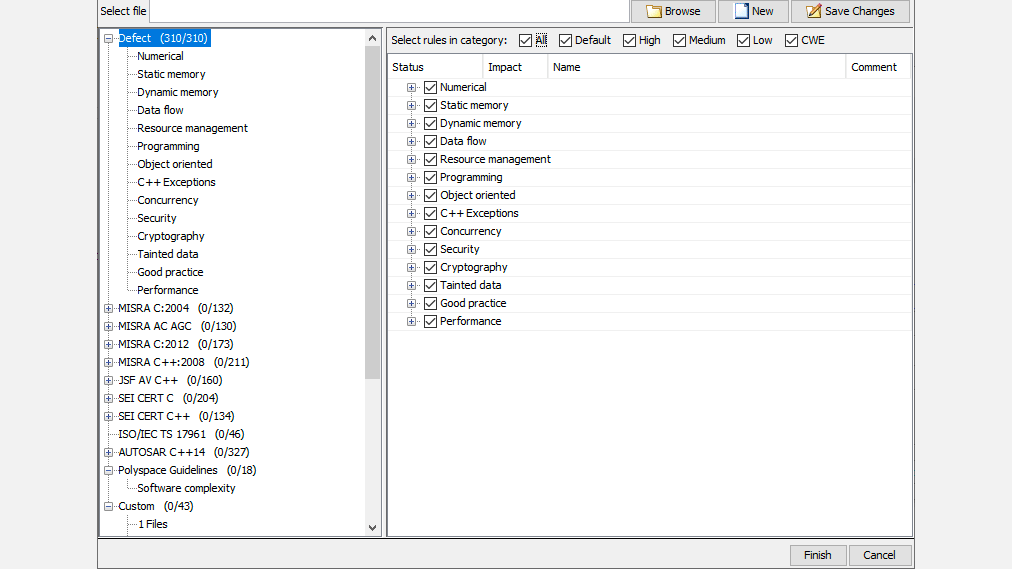
Enforce embedded software coding rules such as MISRA C and MISRA C++, CERT C and CERT C++, AUTOSAR C++14, JSF++, and custom naming conventions while you code.
Review and Triage Static Analysis Results
Review Polyspace results with source code in your web browser. Use navigation tools to investigate and triage results. Share findings and comments to collaborate with team members.
Monitor Project Software Quality
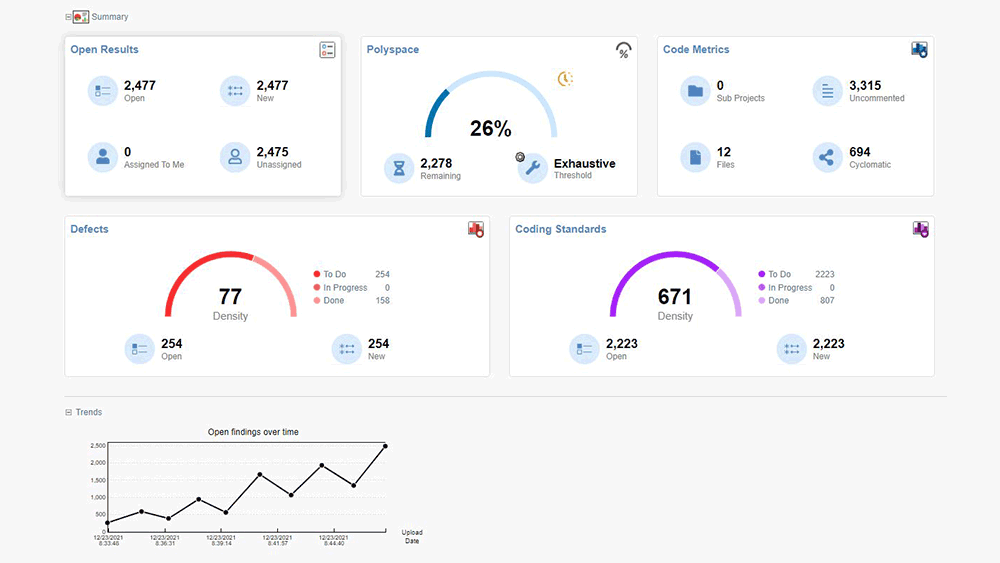
Organize your static code analysis projects to support development teams and workflows. Use information displayed on project dashboards to monitor software quality, project status, the number of defects, and code metrics.
Integrate into Your Software Factory
Integrate Polyspace Access within your software development infrastructure to gate your continuous integration pipelines with static code analysis results and to link code verification findings to your bug-tracking tool and application lifecycle management (ALM). Install and run the Polyspace Access web server close to your toolchain deployment, on-premise or in the cloud.